


Dilwalon ki Dilli | Delhi, the city of big-hearted people
Delhi is a major India anchor for Mughal monuments, markets, food, museums, metro movement, and a layered old-new city contrast. It needs deliberate pacing because the scale can swallow a short visit.
Delhi's air quality turns severe most winters from mid-November through January, when crop-stubble burning in nearby Punjab and Haryana combines with post-Diwali fireworks and a cold-weather inversion that traps smoke over the city. The city has repeatedly triggered GRAP Stage IV emergency rules in recent winters, which include a full construction ban and a shift to hybrid classes for younger students, once AQI readings pass 600 in parts of the city.
Current conditions and the practical reference material that helps turn the saved places into a trip.
7-day forecast from Open-Meteo. UV badges flag days when sun protection matters (3 and above is moderate; 8 and above is risk territory for unprotected fair skin within 30 minutes).
About 81% of the year's rain falls in these months. Typical highs around 37°C, lows around 27°C.
Typical highs around 31°C, lows around 15°C. About 15mm of rain a month.
Public-transit operators within 8 km of the city center. Click through to each operator’s site for routes, fares, and tickets.
Operators and modes are aggregated from individual transit-agency GTFS feeds. Route classifications come from each feed’s route type codes.
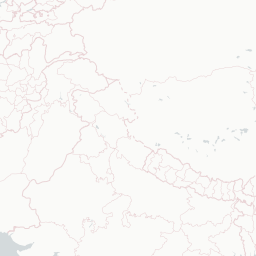
Delhi, officially the National Capital Territory (NCT) of Delhi, is a megacity and a union territory of India containing New Delhi, the capital of India. Straddling the Yamuna river, but spread chiefly to the west, or beyond its right bank, Delhi shares borders with the state of Uttar Pradesh in the east and with the state of Haryana in the remaining directions. Delhi became a union territory on 1 November 1956 and the NCT in 1995. The NCT covers an area of 1,484 square kilometres (573 sq mi). According to the 2011 census, Delhi's city proper population was over 11 million, while the NCT's population was about 16.8 million.
The links below support the changing or licensed reference material on this page. Personal notes and ordinary geographic facts are not footnoted individually.
Monthly highs, lows, rainfall — long-term averages, NASA POWER.
Maps, image licenses, and the full dataset registry are listed in site credits.