


Beim Berg ist Erlangen weltbergühmt. | At Bergkirchweih, Erlangen is world-famous.
Late May to September is best, the famous Bergkirchweih beer festival in late May/early June fills the wooded slopes above town for 12 days, drawing over a million visitors to the second-largest beer festival in Bavaria after Munich's Oktoberfest. The Schlossgarten, Margrave's palace, and Botanical Garden anchor a half-day walking visit. Nuremberg's old town is a 20-minute train ride away.
Bergkirchweih (late May/early June) sees hotel prices triple and book months ahead. Outside the festival, Erlangen is quieter than Nuremberg and not a destination in its own right, better as a base or short stop. The city center empties on Sundays. For Erlangen, opening hours and movement are not secondary details. In Erlangen, a good plan groups nearby stops, leaves slack for transport, and allows for small museums, churches, or galleries to close without much notice.
Current conditions and the practical reference material that helps turn the saved places into a trip.
7-day forecast from Open-Meteo. UV badges flag days when sun protection matters (3 and above is moderate; 8 and above is risk territory for unprotected fair skin within 30 minutes).
Typical highs around 23°C, lows around 12°C. Also the wettest months.
Typical highs around 4°C, lows around -2°C.
Public holidays from Nager.Date.
Public-transit operators within 8 km of the city center. Click through to each operator’s site for routes, fares, and tickets.
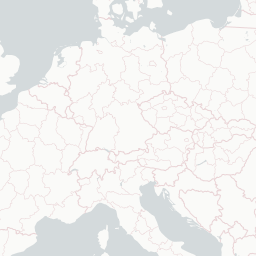
Erlangen is a Middle Franconian city in Bavaria, Germany. It is the seat of the administrative district Erlangen-Höchstadt, and with 120,646 inhabitants, it is the smallest of the eight major cities in Bavaria. The number of inhabitants exceeded the threshold of 100,000 in 1974, making Erlangen a major city according to the statistical definition officially used in Germany.
The links below support the changing or licensed reference material on this page. Personal notes and ordinary geographic facts are not footnoted individually.
Monthly highs, lows, rainfall — long-term averages, NASA POWER.
Operators and modes are aggregated from individual transit-agency GTFS feeds. Route classifications come from each feed’s route type codes.
Maps, image licenses, and the full dataset registry are listed in site credits.