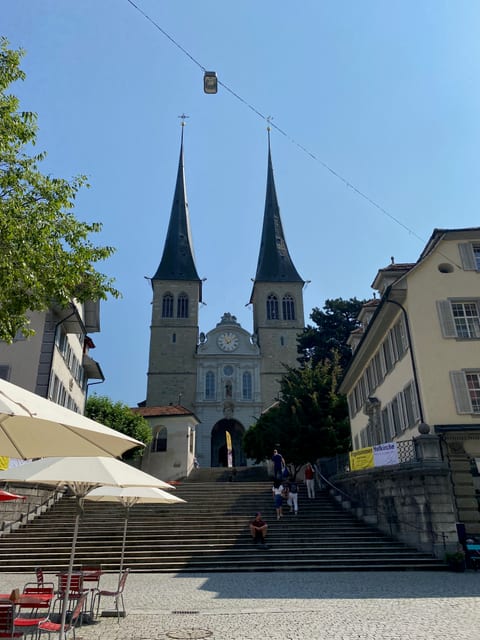
Luzerne, the heart of Switzerland, where the lake and mountains meet.
Lucerne is a clean Swiss introduction: lake, bridges, old town, mountain railways, boat rides, and hotels that make the logistics easy. It is useful when the trip wants scenery without giving up city comfort.
Visiting Luzern for a trip can be challenging during the peak summer months of July and August. The city experiences a surge in tourist activity during this time, leading to crowded attractions, long lines, and higher prices for accommodations. Additionally, the hot and humid weather can make outdoor sightseeing and activities uncomfortable for some visitors. To avoid the crowds and enjoy a more relaxed experience, it is advisable to plan your trip during the shoulder seasons of spring or fall when the weather is milder and the tourist crowds are thinner.
Current conditions and the practical reference material that helps turn the saved places into a trip.
7-day forecast from Open-Meteo. UV badges flag days when sun protection matters (3 and above is moderate; 8 and above is risk territory for unprotected fair skin within 30 minutes).
Typical highs around 20°C, lows around 11°C. Also the wettest months.
Typical highs around 3°C, lows around -4°C.
Public holidays from Nager.Date.
Public-transit operators within 8 km of the city center. Click through to each operator’s site for routes, fares, and tickets.
Lucerne or Luzern is a city and a municipality in central Switzerland, in the German-speaking portion of the country. Lucerne is the capital of the canton of Lucerne and part of the district of the same name. With a population of approximately 82,000 people, Lucerne is the most populous city in Central Switzerland, and a nexus of economics, transport, culture, and media in the region. The city's urban area consists of 19 municipalities and towns with an overall population of about 220,000 people.
The links below support the changing or licensed reference material on this page. Personal notes and ordinary geographic facts are not footnoted individually.
Monthly highs, lows, rainfall — long-term averages, NASA POWER.
Operators and modes are aggregated from individual transit-agency GTFS feeds. Route classifications come from each feed’s route type codes.
Maps, image licenses, and the full dataset registry are listed in site credits.